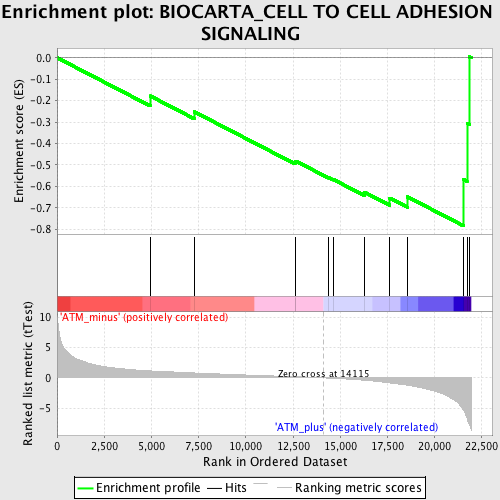
Profile of the Running ES Score & Positions of GeneSet Members on the Rank Ordered List
| Dataset | Set_01_ATM_minus_versus_ATM_plus.phenotype_ATM_minus_versus_ATM_plus.cls #ATM_minus_versus_ATM_plus.phenotype_ATM_minus_versus_ATM_plus.cls #ATM_minus_versus_ATM_plus_repos |
| Phenotype | phenotype_ATM_minus_versus_ATM_plus.cls#ATM_minus_versus_ATM_plus_repos |
| Upregulated in class | ATM_plus |
| GeneSet | BIOCARTA_CELL TO CELL ADHESION SIGNALING |
| Enrichment Score (ES) | -0.7848176 |
| Normalized Enrichment Score (NES) | -1.8555073 |
| Nominal p-value | 0.0 |
| FDR q-value | 0.025424615 |
| FWER p-Value | 0.316 |
| PROBE | DESCRIPTION (from dataset) | GENE SYMBOL | GENE_TITLE | RANK IN GENE LIST | RANK METRIC SCORE | RUNNING ES | CORE ENRICHMENT | |
|---|---|---|---|---|---|---|---|---|
| 1 | CDH1 | 1443509_at 1448261_at | 4931 | 1.148 | -0.1783 | No | ||
| 2 | PXN | 1424027_at 1426085_a_at 1456135_s_at | 7270 | 0.803 | -0.2524 | No | ||
| 3 | PTPN11 | 1421196_at 1427699_a_at 1451225_at | 12606 | 0.188 | -0.4881 | No | ||
| 4 | SRC | 1423240_at 1450918_s_at | 12634 | 0.185 | -0.4818 | No | ||
| 5 | CTNNA1 | 1437275_at 1437807_x_at 1443662_at 1448149_at | 14376 | -0.040 | -0.5596 | No | ||
| 6 | BCAR1 | 1439388_s_at 1450622_at | 14615 | -0.077 | -0.5673 | No | ||
| 7 | ACTA1 | 1427735_a_at | 16285 | -0.393 | -0.6275 | No | ||
| 8 | CTNNB1 | 1420811_a_at 1430533_a_at 1450008_a_at | 17618 | -0.827 | -0.6547 | Yes | ||
| 9 | VCL | 1416156_at 1416157_at 1445256_at | 18558 | -1.197 | -0.6489 | Yes | ||
| 10 | CSK | 1423518_at 1439744_at | 21538 | -5.342 | -0.5679 | Yes | ||
| 11 | PECAM1 | 1421287_a_at 1447092_at | 21715 | -6.635 | -0.3065 | Yes | ||
| 12 | PTK2 | 1423059_at 1430827_a_at 1439198_at 1440082_at 1441475_at 1443384_at 1445137_at | 21846 | -7.797 | 0.0041 | Yes |

